An advanced indicator packed with unique, data-driven features to help traders make confident decisions across any asset or timeframe. Tailored for seasoned day traders who want sharper, more strategic guidance when managing open positions. Perfect for traders who are volatility harvesting for daily gains.
Full Feature Descriptions
Denoise Setting: 0
Denoise Setting: 4
Denoise Setting: 20
Automatic Candle Coloring
Highly Adaptive
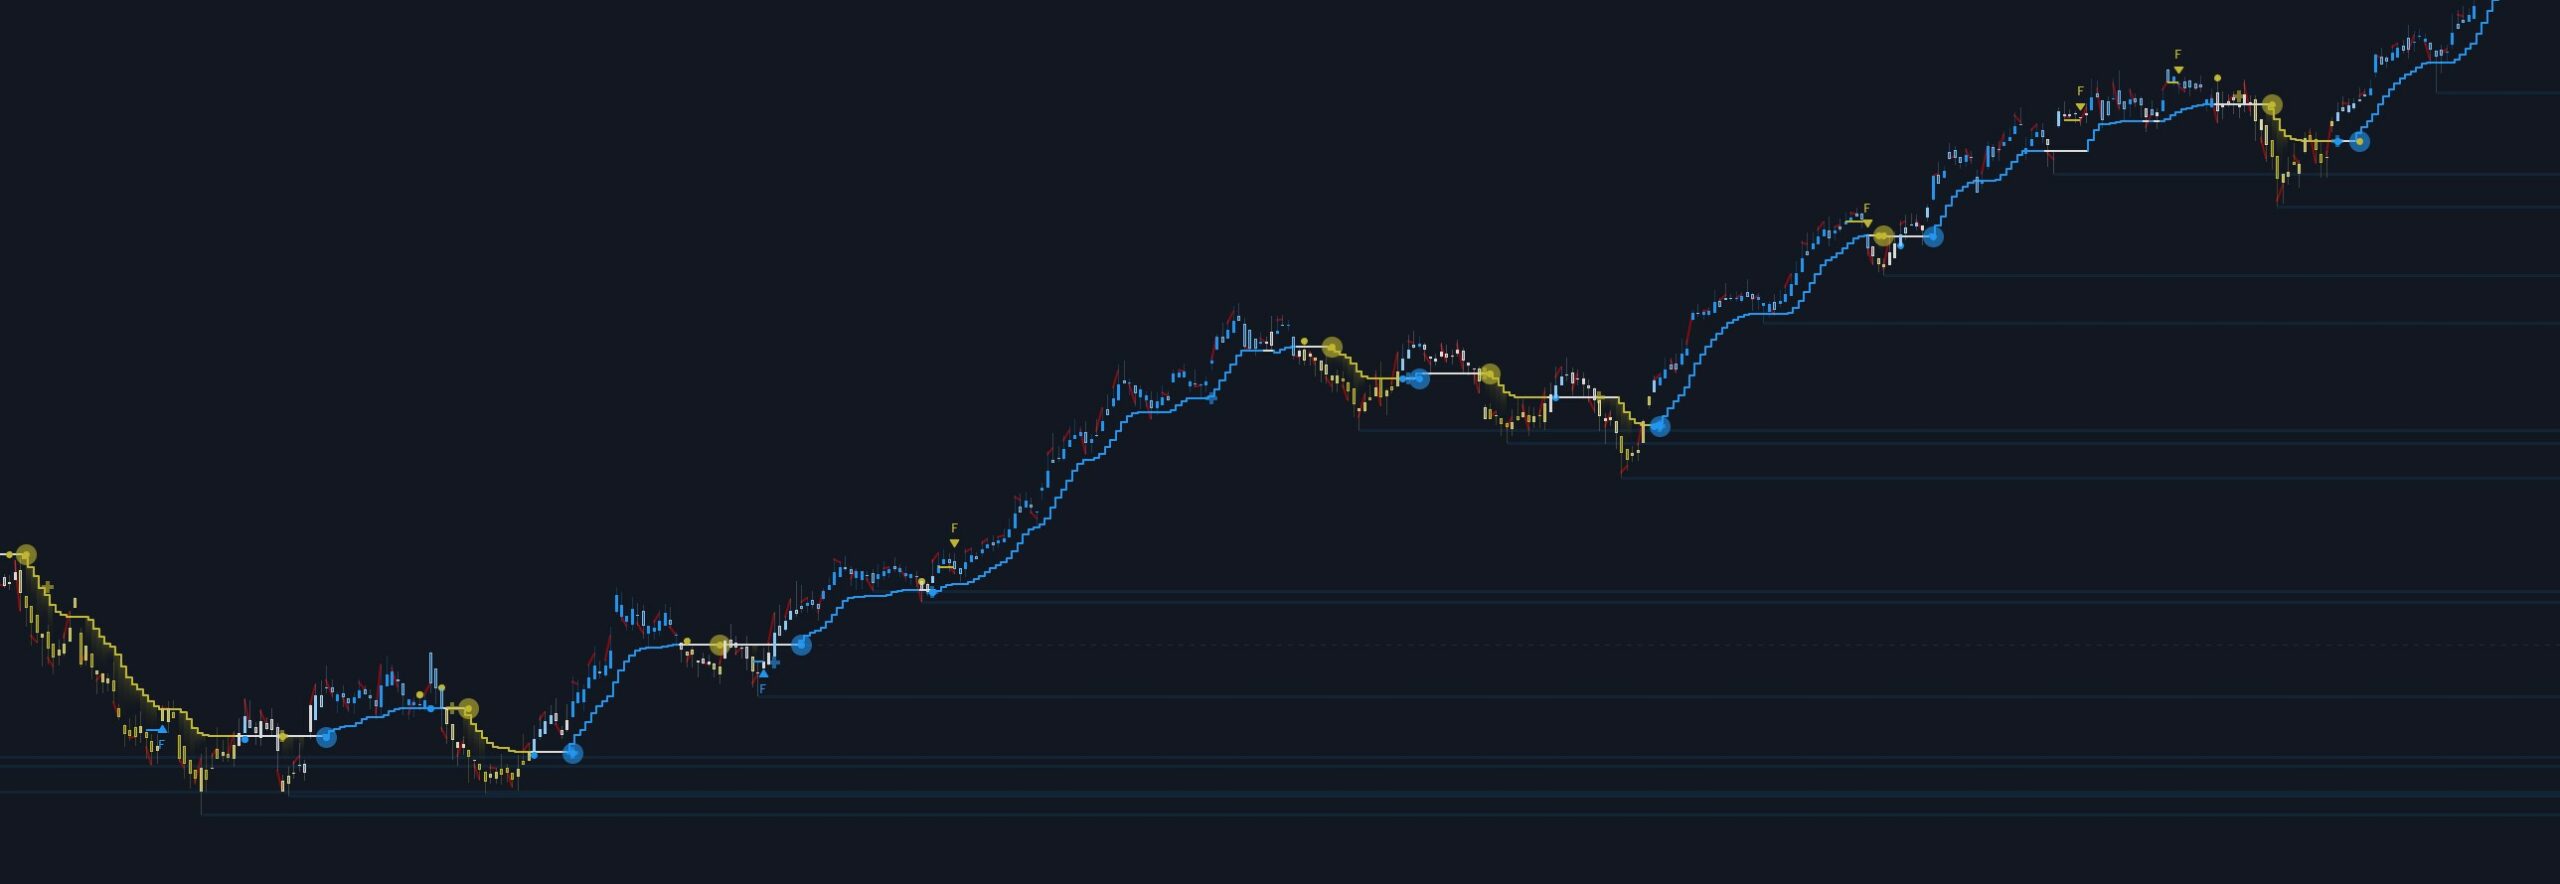
The Contiguous Stopline is an adaptive trend tool built to be smarter than your average indicator. It considers volume and volatility, and knows when to stay flat instead of forcing a directional bias—like a supertrend of the future.
It’s non-repainting, highly flexible, and works across any timeframe.
Built to clarify which side of the trend to be on, and it’s saved me from both extremes: holding too long (diamond hands shattered) and selling too soon (paper cuts that could’ve turned profitable).
No messy whipsaws.
Built to cut through the noise so real trends are easier to spot. It softens choppy price action, helping clarify direction at a glance—especially when things get messy.
It preserves all original candle wicks but denoises the candle bodies—making directional bias clearer without sacrificing price precision.
For active day and swing traders, it’s a great way to help you stay on the right side of the move when uncertainty increases.
Wedge breaks are one of the most common and effective trade setups. This feature automatically detects and draws valid wedge formations when they appear, adding visual confirmation of pressure building toward one side.
As price begins to range, you’ll often see it bounce within a tightening wedge—when that structure breaks, it often signals enough momentum for a meaningful move.
Automatic cleanup of old wedges keeps chart clean.
VWAP (Volume Weighted Average Price) is one of the most widely used and reliable indicators in trading.
When price begins to diverge from VWAP, small cross markers appear to signal potential pullbacks or trend exhaustion zones—giving you an early heads-up when momentum may be fading.
Standard VWAP line is also included to avoid the need for additional indicators.
To stay in view, VWAP is also plotted as an extended line to the right of price, aligning with the other dynamic support and resistance visuals.
Failed continuations are flagged with a subtle arrow and an “F,” clearly marking where a breakout attempt didn’t hold—so you can spot fakeouts quickly and adjust your plan accordingly.
When enough of the algo’s signals align to suggest a shift in bias, a large transparent dot appears—clearly signaling that control has likely flipped to the other side.
On higher timeframes, this can be a good opportunity to start building a position. On shorter timeframes, these shifts often make solid scalp entries.
A powerful way to avoid getting caught in chop. When price stays stuck in a range for more than a set number of candles, a labeled zone box is automatically drawn and continues expanding until a clean break occurs.
These zones help you visually avoid low-probability setups where continuation is unlikely—and patience pays.
This is a unique feature you won’t find anywhere else. It tracks how often a stock trends in a particular direction, helping you gauge how “normal” its current behavior really is. For example, if something consistently trends down, a bear run might not be unusual—but you’d never know that just by glancing at a chart.
The frequency chart keeps you grounded when things get stretched too far in one direction, and the Trend Status Panel gives you a quick read on where the stock currently sits.
It also includes a compact mode, condensing all that information into a small square that still shows the current trend state at a glance.
A unique feature that prioritizes recent data while gradually easing the influence of older candles—similar in concept to how an exponential moving average differs from a simple one, but applied across a range of signal logic, not just averages.
It ensures only relevant historical levels are displayed, reducing visual clutter and helping you focus on what actually matters now. This keeps your charts clean and your decisions sharper.
It also affects how long gap detection boxes are considered “new,” adapting their significance based on time and recency.
CharSupport and resistance zones are dynamically generated and continuously updated based on active price action—helping you quickly identify short-term floors and ceilings for potential trade setups.
The closest levels to current price are displayed as ATR-sized zone blocks, acknowledging that support and resistance aren’t exact—they’re areas, not lines.
Includes a live VWAP level to keep everything you need in one place—no extra indicators required.
Designed for intraday traders, this helps you unobtrusively see the previous days Open/High/Low/Close levels on todays chart.
Users can disable this feature if not needed and it won’t calculate.
A lower-histogram confirmation tool designed specifically for day traders. While it may resemble a MACD at first glance, its internal logic is entirely different—and far more effective. The difference in performance is night and day. When paired with the main algorithm, it brings clarity to tough decisions: whether to hold, reduce, or exit entirely. It’s adaptive, streamlined, and intentionally minimal—built to support your decisions without adding noise. Works seamlessly across any timeframe or chart type.
Full Feature Descriptions
Bright histogram bars indicate stronger pressure.
Expanding histogram bars mean growing pressure.
Underlined histogram indicates the presence of additional support.
Best paired with another tool as this is meant to serve as confirmation and to provide trade confidence.
White zones have pressure but it may not be accompanied by expected price action, these are wait zones.
The histogram background color blocking only changes sides when enough power has shifted, this acts as support system for the histogram that is easy to read at a glance.
Continuous measurement of rate of change and high and low bypass filtered data gives accurate feedback on which side has more pressure on it to affect price.
A simple line is drawn under a trend only when an automatic multiplier of the current settings is aligned with the active current settings. This gives you an easy way to see if it is part of a larger move at a glance.
Built to clarify which side of the trend to be on, and it’s saved me from both extremes: holding too long (diamond hands shattered) and selling too soon (paper cuts that could’ve turned profitable).
Similar to Multiplier support, a simple line is drawn under a trend only when volume is also aligned with it. This gives you an easy way to see if it is an empty love volume push, or if there is more power behind a move.
Peak levels create bands. These bands make it easy to see when a push exceeds a previous level. When a level is exceeded, it is usually a sign of a lot of trade pressure and a break can be more probable.
Designed to be easy to read at a glance
Trend blocking also has colors which are easy to interpret.
Failed inverse attempts followed by a previous level break often result in larger move in the larger trend direction… As seen in the example image.
A non-repainting, unique, multi-timeframe approach to the traditional supertrend. “In true TradingView spirit, the creator of this script has made it open-source, so that traders can review and verify its functionality. Kudos to the author!” –TradingView
Full Feature Descriptions
Creates Four Automatic Higher Timeframe Supertrends based on parameters you choose to help you determine larger trends while only needing a single chart.
Confident trends can be identified by having two or more lines in the same direction.
Higher timeframe supertrends can show support or resistance and act as stop loss limit ranges if you choose.
Unify keeps things a bit cleaner and more compact.
When unified, the intensity of the glow should increase a trends confidence.
Unify collapses the 3 highest timeframe supertrends into the first higher timeframe supertrend.
Without Unify on, the overall trends are usually easier to see at just a glance.
A three moving average option added to help visualize trends.
This is a very common approach often referred to as alligator trading.
Papercuts Time Sampled Higher Timeframe EMA Without Security
This is an Exponential Moving Average that simulates higher-timeframe behavior using a time sampling method—instead of relying on TradingView’s security() function to pull higher-timeframe data. This approach is more efficient, as it reduces data queries and avoids the repainting issues commonly associated with security() calls. I thre in some candle coloring just for fun.
TradingView users know how tricky repainting can be, so this method offers a cleaner, more reliable alternative. It’s a concept I came up with that I thought others might find both useful and interesting. For the math nerds out there—yes, this is Fun with Modulus! Feel free to dive into the code if you’re curious
This is currently an experimental visual exploratory concept to explore how can we seamlessly transition between actual and smoothed price data sets as the data ages. Experimental tools should only be explored by fellow coders and experienced traders. For a full description, please visit link.
🤝 Have an idea for your own indicator?
I’d love to help you build it. Let’s turn your idea into something real—and usable. Don’t worry, there will be no data selling or email lists you’ll get on. We’re not into that crap either.
Disclaimer: This product is designed for educational and entertainment purposes only. The concepts, strategies, and terminology presented in this game do not constitute financial or investment advice. Day trading involves significant risk, and the majority of traders may experience financial losses. Neither the creators of this game nor its distributors make any guarantees regarding trading success, profitability, or financial outcomes. You should conduct your own research and consult with a licensed financial professional before making any investment decisions. By using this product, you acknowledge and agree that the creators, manufacturers, and distributors are not liable for any financial losses, trading decisions, or other consequences resulting from the use of this material. This game is not affiliated with, endorsed by, or sponsored by any financial institution, regulatory body, or trading platform.